Software Reliability Metrics
Software Reliability Metrics relates to measurements made for assessing software reliability. Most of these software reliability metrics evolved from the earlier hardware reliability metrics. The following table gives the various Software Reliability metrics used, their definition and example system in which they can be applied.
| Software Reliability Metrics | Definition | Eg. Systems | |
| 1. | POFOD – Probability of Failure on Demand | Calculated as a measure of the likelihood that the system will fail when a services is requested i.e. a POFOD value of 0.001 indicates that 1 out of 1000 service requests may result in a failure. | Safety-critical and non-stop systems like hardware control system |
| 2. | ROCOF – Rate of failure occurrence or Failure Intensity | Calculated as a measure of the frequency of occurrence with which the unexpected behavior is likely to occur i.e. a ROCOF value of 2/100 means that 2 failures may occur in each 100 operational time units. | Operational systems or OLTPs (Online Transaction Processing Systems) |
| 3. | MTTF -Mean Time to Failure | Calculated as a measure of time between observed system failure i.e. an MTTF value of 500 shows that failure can be expected every 500 time units. If the system is unchanged, MTTF = 1/ROCOF | Systems with long transactions. Here MTTF should be > transaction time. |
| 4. | AVAIL | Calculated as a measure of how likely the system is to be available for use i.e. an AVAIL value of 0.998 means that in 1000 time units, the system is likely to be available for 998 of these. | Continuously running systems such as cellphone/telephone carriers based systems. |
Significance of Timing factor used in Reliability Metric
The time factor used in Reliability metric calculations are significant since appropriate time units should be chosen if measurements are to be meaningful. The various units of time used are calendar time, processor time and number of transactions. Calendar time may be suitable for systems which are in continuous operations like the monitoring systems and process control systems. Calendar time is not suitable for systems like Telephone/Cellphone carrier systems since such systems spend much of their time waiting to respond to a service request. In such case, processor time is the appropriate unit of time. Number of transactions may be used as a timing factor in various types of transaction processing systems.
Criteria for selecting Reliability Metric
General Criteria – The general criteria for the selection of reliability metric for a system is as follows –
| Criteria | Reliability Metric |
| Systems in which the users are most concerned about how often the system will fail since the cost is significant in restarting the system. | ROCOF |
| Systems in which it is essential that a service request should always be met since there is some cost in failing to deliver the service. Also the number of failures in some period is less important. | POFOD |
| Systems which is to be available all the time to satisfy the operations to provide a service request and incur some loss if the system is unavailable | AVAIL |
Standard Criteria by Reliability specifications
Standard criteria for selecting reliability metrics may be derived by preparing a reliability specification. Reliability specification is prepared in the following steps –
- Identify the various sub-systems of the main unit
- For each sub-system, identify the various system failures that are likely to occur and then analyze their consequences of these failures.
- From the system failure analyses, identify common type of failures and then partition them into appropriate classes as follows –
| Failure Type | |
| Transient | Those which occurs only with certain inputs |
| Permanent | Those which occur with all types of inputs |
| Recoverable | Those which may be recovered without operator intervention |
| Unrecoverable | Those which may be recovered only by operator intervention |
| Non-corrupting | Those which do not corrupt system state or data |
| Corrupting | Those which corrupts system state or data |
For each failure class identified, define the reliability metric which is most appropriate. The following table shows an example of such a reliability specification derived on the basis of failure classes.
| Failure Class | Example | Reliability Metric |
| Permanent non-corrupting | The system fails to operate with any type of input device that is inserted. Software may be restored to correct failure. | ROCOF 2 occurrence/1000 days |
| Transient non-corrupting | The system cannot read data from a faulty input device | POFOD 5 / 1000 |
| Transient corrupting | A part of database input causing database corruption | unquantifiable |
Software Reliability Growth Modelling
Software reliability models are used to plot the measured reliability values against time so that software personnel could predict when the required system reliability is reached and make other assessments. Software reliability models are mathematical models of software reliability which predicts how software reliability should improve over time as failures are discovered and repaired. The following are two commonly used software reliability models –
A. Simple equal-step model
The Simple equal step model has following features –
- Assumes that software repairs made will never increase the number of faults
- Assumes that any repair will only increase software reliability. But actually a repair may increase the probability for new faults
- Assumes that with each fault repair the reliability increases by constant increment while this is not the case in all software faults
B. Random-Step-Function model
Random step function model has the following features –
- It takes into account of the fact that fault repair may reduce software reliability by introducing new errors as shown as segment AB.
- It shows that the average improvement in reliability decreases per repair as shown above as different reliability improvement in which the second step involves a lesser improvement in reliability than the first step. The reason is that more faults are identified and repaired during early testing stages.
Predicting Software Reliability
While predicting software reliability levels, the different levels of reliability are plotted against the time between various releases of the system that are statistically tested as shown below –
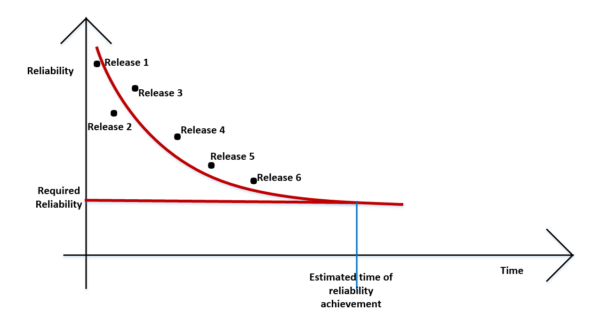
Step 1: As shown above, the various reliability levels during each system release is plotted against time. The target system reliability is also included on the graph.
Step 2:
if (draft system reliability is reached when the model is being used, ie. if the required reliability value is in between or on the plotted points (however this situation is never achieved)
Then {
conclude that required reliability is achieved within the indicated time limits and there is no need for further testing;
exit process;
}
else if (target system reliability is not achieved when the model is being used)
Then {
go to step 3;
}
Step 3: Select a suitable reliability model (usually a dynamic model which gives curve plots) & fit a curve on the above plotted points.
if (best curve fit is made) Then Goto Step 4
else {
Repeat Step 3 until a best fit is made
}
Step 4: Apply the model formula to find the point of time at which he required reliability will be achieved as shown in the above graph. In many cases, testers could find this by drawing perpendiculars to the curve as shown in the figure above.
Now, it may be noted that it is unlikely, in many cases, to achieve the required reliability as it takes a considerable time. Experts also point out that it is reliable to use the reliability model which best fits the reliability data.